Forecasting Time Series data with Prophet in python

Forecasting time series data can be a challenging task. There are a number of methods that can be used, but finding the right one for your data can be difficult. In my case I wanted to forecast my local gym capacity.
One method that has been gaining popularity in recent years is Prophet, a time series forecasting library for python.Prophet is a open source library developed by Facebook that is based on decomposing time series into trends and seasonality.It is a simple and flexible tool that can be used for a variety of time series forecasting tasks.In this blog post, I will show how to use Prophet to forecast time series data.
You can find full code here, inside a respository that also is a web app that viualises and collect data.
First we need to install depndencies, it can be a bit tricky with prophet, but a simple
pip install prophetWe start our code with importing libraries
from prophet import Prophet
import datetime
import sqlalchemy
import requests
import os
I use sqlalchemy here to periodically pull data from Postgres DB with updated gym data, After connecting to sqlalchemy we start by pulling data from our DB. And create Prophet, the higher your seasonality the more time it will take you model to train but it will make results better.
df = pd.read_sql_query("SELECT * FROM clubs WHERE name = '"+ location['name'] +"'", con=connection)
m = Prophet(interval_width=0.95, weekly_seasonality=35, daily_seasonality=35)
Next we prepare our data and run it, as Prophet needs y column to be the metric, and ds as date.
df.rename(columns={'date_created': 'ds'}, inplace=True)
df.rename(columns={'percentage': 'y'}, inplace=True)
df = df[df['name'] == location['name']]
m.fit(df)
future = m.make_future_dataframe(periods=288, freq='5min', include_history=False)
forecast = m.predict(future)
Finally we create data frame from predicted data
df = forecast[['ds', 'yhat']]We can use it to plot a graph with predicted and previous data like this
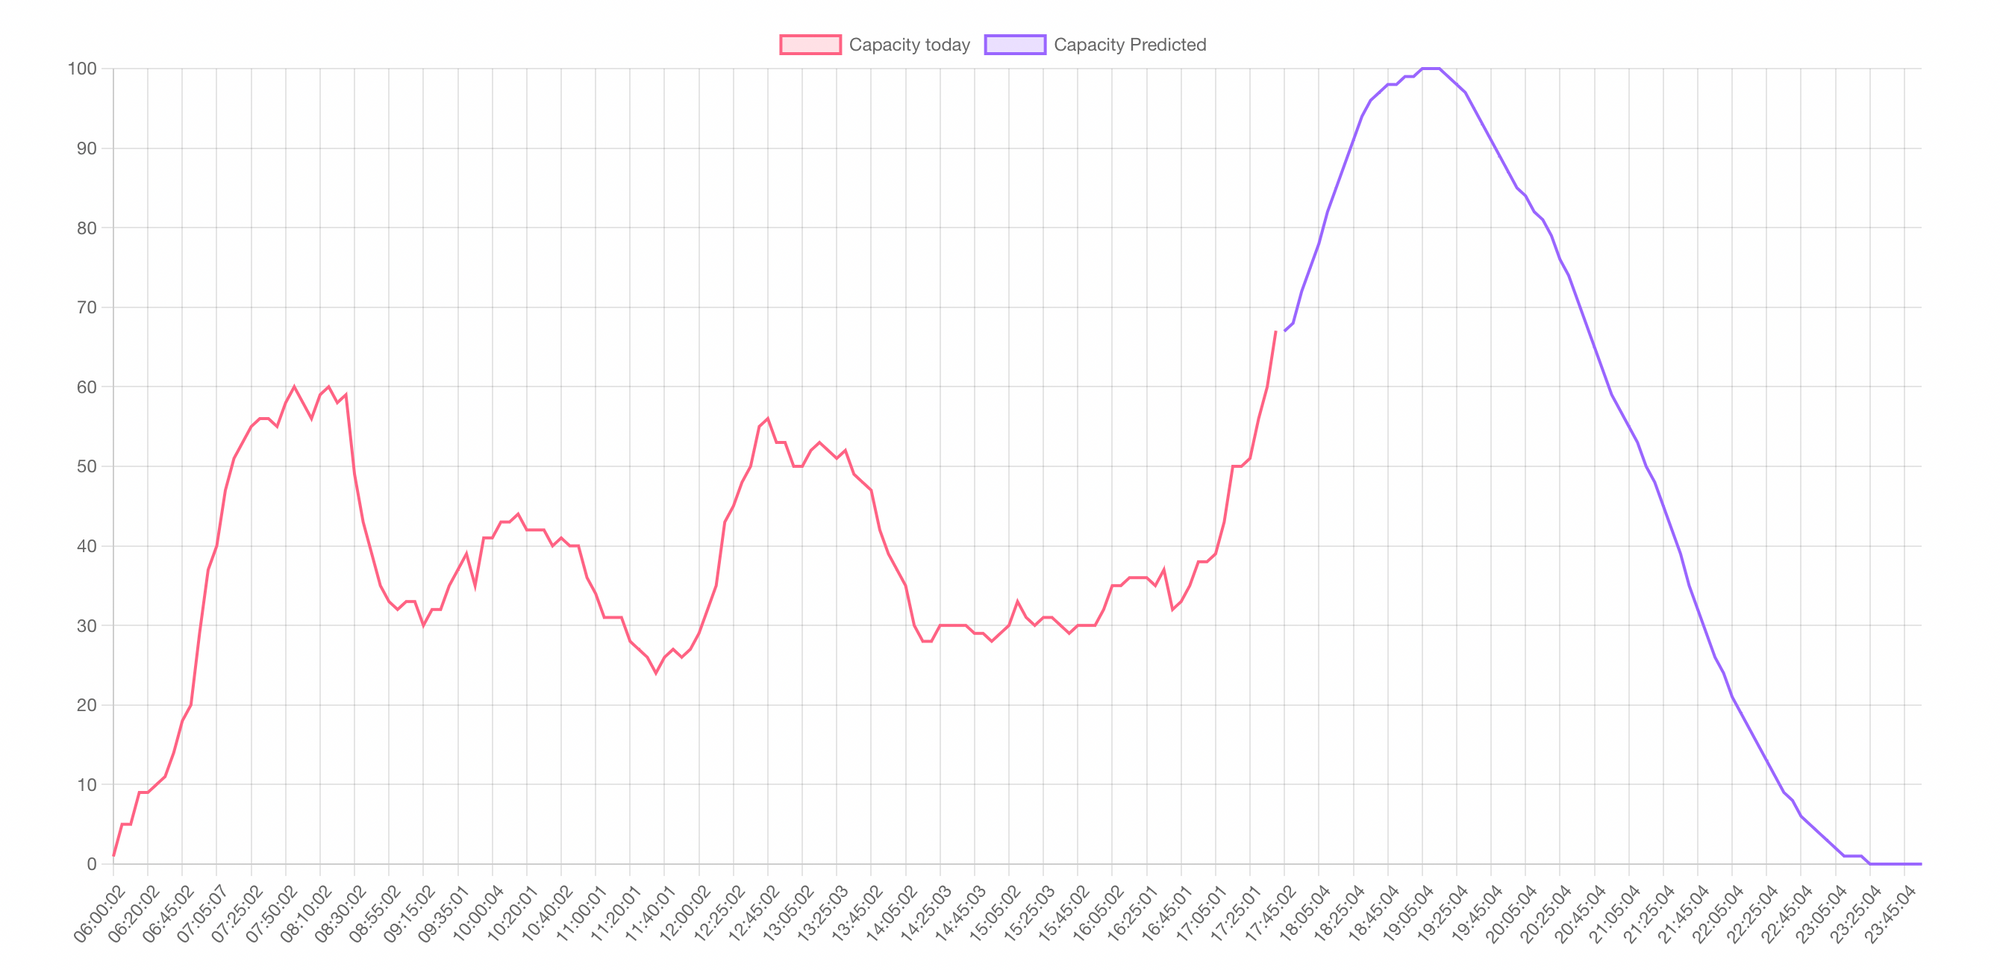
I used chartjs and d3 to plot it, I will discuss how you can achieve it in my next posts. You can also check this working on my website